python如何实现在一个画布上画多个子图 python实现在一个画布上画多个子图代码
本篇文章小编给大家分享一下python实现在一个画布上画多个子图代码,小编觉得挺不错的,现在分享给大家供大家参考,有需要的小伙伴们可以来看看。
matplotlib 是可以组合许多的小图, 放在一张大图里面显示的. 使用到的方法叫作 subplot.
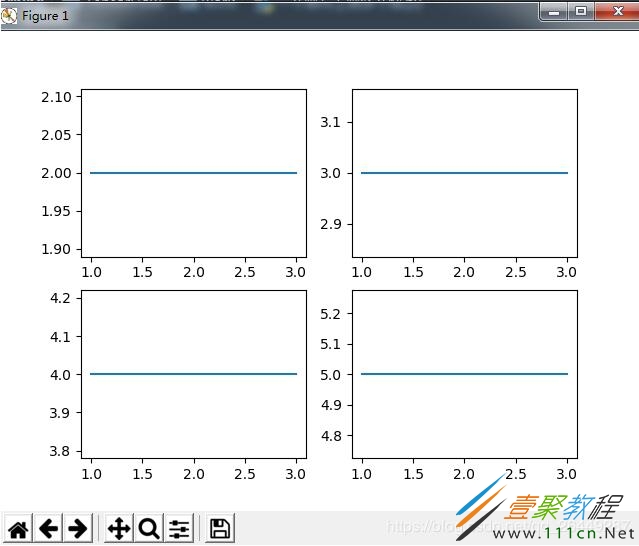
均匀画图
使用import导入matplotlib.pyplot模块, 并简写成plt. 使用plt.figure创建一个图像窗口.
import matplotlib.pyplot as plt

plt.figure()
使用plt.subplot来创建小图. plt.subplot(2,2,1)表示将整个图像窗口分为2行2列, 当前位置为1. 使用plt.plot([0,1],[0,1])在第1个位置创建一个小图.
plt.subplot(2,2,1)
plt.plot([0,1],[0,1])
plt.subplot(2,2,2)表示将整个图像窗口分为2行2列, 当前位置为2. 使用plt.plot([0,1],[0,2])在第2个位置创建一个小图.
plt.subplot(2,2,2)
plt.plot([0,1],[0,2])
plt.subplot(2,2,3)表示将整个图像窗口分为2行2列,当前位置为3. plt.subplot(2,2,3)可以简写成plt.subplot(223), matplotlib同样可以识别. 使用plt.plot([0,1],[0,3])在第3个位置创建一个小图.
plt.subplot(223)
plt.plot([0,1],[0,3])
plt.subplot(224)表示将整个图像窗口分为2行2列, 当前位置为4. 使用plt.plot([0,1],[0,4])在第4个位置创建一个小图.
plt.subplot(224)
plt.plot([0,1],[0,4])

plt.show() # 展示
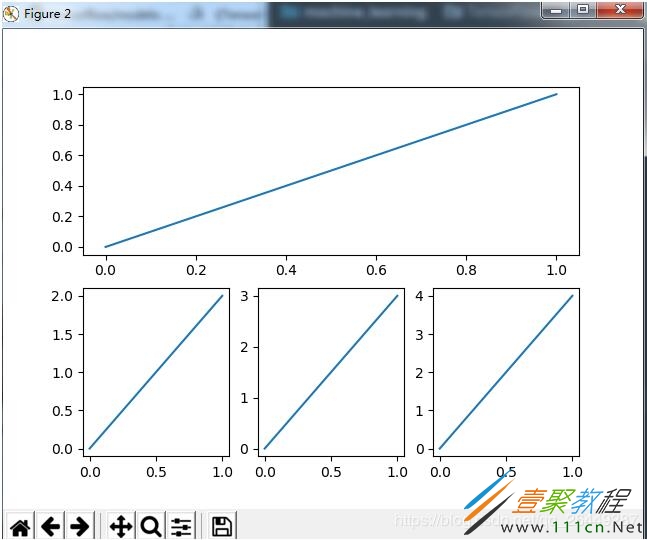
不均匀画图
如果希望展示的小图的大小不相同, 应该怎么做呢? 以上面的4个小图为例, 如果把第1个小图放到第一行, 而剩下的3个小图都放到第二行.
使用plt.subplot(2,1,1)将整个图像窗口分为2行1列, 当前位置为1. 使用plt.plot([0,1],[0,1])在第1个位置创建一个小图.
plt.subplot(2,1,1)
plt.plot([0,1],[0,1])
使用plt.subplot(2,3,4)将整个图像窗口分为2行3列, 当前位置为4. 使用plt.plot([0,1],[0,2])在第4个位置创建一个小图.
plt.subplot(2,3,4)
plt.plot([0,1],[0,2])
这里需要解释一下为什么第4个位置放第2个小图. 上一步中使用plt.subplot(2,1,1)将整个图像窗口分为2行1列, 第1个小图占用了第1个位置, 也就是整个第1行. 这一步中使用plt.subplot(2,3,4)将整个图像窗口分为2行3列, 于是整个图像窗口的第1行就变成了3列, 也就是成了3个位置, 于是第2行的第1个位置是整个图像窗口的第4个位置.
使用plt.subplot(235)将整个图像窗口分为2行3列,当前位置为5. 使用plt.plot([0,1],[0,3])在第5个位置创建一个小图. 同上, 再创建plt.subplot(236).
plt.subplot(235)
plt.plot([0,1],[0,3])

plt.subplot(236)
plt.plot([0,1],[0,4])

plt.show() # 展示
完整代码
plt.figure()
plt.subplot(2,1,1)
plt.plot([0,1],[0,1])

plt.subplot(2,3,4)
plt.plot([0,1],[0,2])

plt.subplot(235)
plt.plot([0,1],[0,3])

plt.subplot(236)
plt.plot([0,1],[0,4])

plt.show() # 展示
结果如下