Python基于pyecharts如何实现关联图绘制 Python基于pyecharts实现关联图绘制代码
作者:袖梨
2020-03-27
本篇文章小编给大家分享一下Python基于pyecharts实现关联图绘制代码,对大家的学习有一定的帮助,小编觉得挺不错的,现在分享给大家供大家参考,有需要的小伙伴们可以来看看。
画图的步骤主要分为:
1. 将距离数据(或者相关数据)读入;
2. 按照一定的格式和参数将数据保存为json字符串;
3. 根据json串,绘制关联图。
具体而言,主要是:
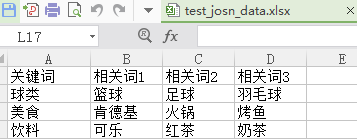
<1>. 首先有一批数据,如图所示:
<2>. 导入所需要的包
import json
import pandas as pd
import random
import copy
<3>. 产生颜色随机值的函数
# 随机颜色
def randomcolor_func():
  color_char = ['1','2','3','4','5','6','7','8','9','A','B','C','D','E','F']
  color_code = ""
  for i in range(6):
    color_code += color_char[random.randint(0,14)] # randint包括前后节点0和14
  return "#"+color_code
<4>. 生成随机坐标
# 随机坐标
#生成随机数,浮点类型
def generate_position(n):
#  n = 10
  for i in range(n):
    x = round(random.uniform(-2000, 2000), 5) #一定范围内的随机数,范围可变
    y = round(random.uniform(-2000, 2000), 5) #控制随机数的精度round(数值,精度)
  return x, y
<5>. 生成json格式的节点数据
def create_json(data, weights):
  # 自定义节点
  address_dict = {"nodes":[], "edges":[]}
  node_dict = {
     "color": "",
     "label": "",
     "attributes": {},
     "y": None,
     "x": None,
     "id": "",
     "size": None
    }
  edge_dict = {
     "sourceID": "",
     "attributes": {},
     "targetID": "",
     "size": None
    }

  # 给节点赋值
  for ii in range(len(data)):
    for jj in range(len(data.iloc[ii])):
      # node,"attributes"属性可自行设置
      node_dict[r"color"] = randomcolor_func()
      node_dict[r"label"] = data.iloc[ii, jj]
      x, y = generate_position(1)
      node_dict[r"y"] = y
      node_dict[r"x"] = x
      node_dict[r"id"] = data.iloc[ii, jj]
      node_dict[r"size"] = int(weights.loc[data.iloc[ii, jj]])

      tmp_node = copy.deepcopy(node_dict)
      address_dict[r"nodes"].append(tmp_node)

  for ii in range(len(data)):
    for jj in range(1, len(data.iloc[ii])):
      # edge
      edge_dict[r"sourceID"] = data.iloc[ii, 0]
      edge_dict[r"targetID"] = data.iloc[ii, jj]
      edge_dict[r"size"] = 2

      tmp_edge = copy.deepcopy(edge_dict)
      address_dict["edges"].append(tmp_edge)

  return address_dict
<6>. 主函数生成json数据
if __name__ == '__main__':
  # read data
  data = pd.read_excel(r'test_josn_data.xlsx', 0)

  weights = pd.DataFrame({"词频":[100, 40, 30, 20, 90, 50, 35, 14, 85, 38, 29, 10]},
              index = ['球类','篮球','足球','羽毛球','美食','肯德基','火锅','烤鱼','饮料','可乐','红茶','奶茶']) #建立索引权值列表

  address_dict = create_json(data, weights)

  with open("write_json.json", "w", encoding='utf-8') as f:
    # json.dump(dict_, f) # 写为一行
    json.dump(address_dict, f, indent=2, ensure_ascii=False) # 写为多行
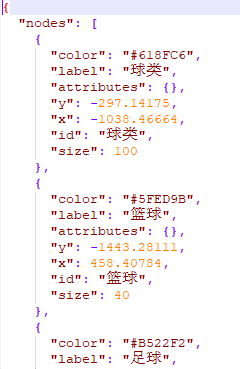
最后形成的json数据如下:
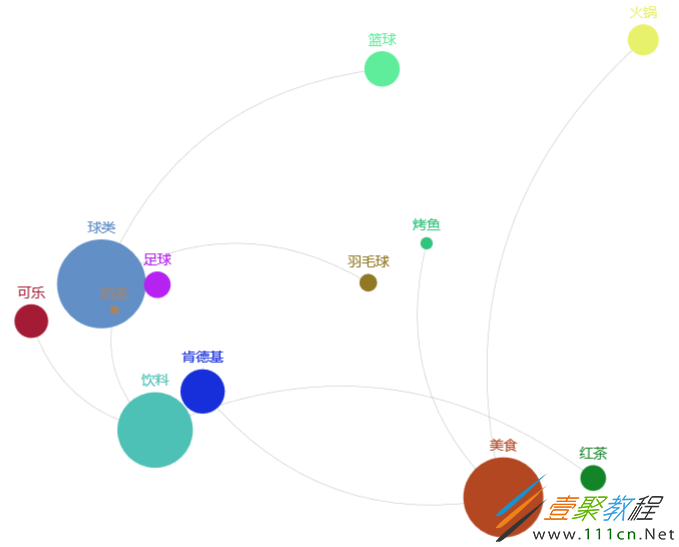
<7>. 绘制关联图,里面的文件读取和保存地址自行修改,write_json.json 就是上面保存的json文件
import pyecharts.options as opts
from pyecharts.charts import Graph
import json

with open(r"D:Python_workspacespyder_spacetest_各种功能write_json.json", encoding='utf-8') as f: #设置以utf-8解码模式读取文件,encoding参数必须设置,否则默认以gbk模式读取文件,当文件中包含中文时,会报错
  data = json.load(f)
#print(data)

nodes = [
  {
    "x": node["x"],
    "y": node["y"],
    "id": node["id"],
    "name": node["label"],
    "symbolSize": node["size"],
    "itemStyle": {"normal": {"color": node["color"]}},
  }
  for node in data["nodes"]
]

edges = [{"source": edge["sourceID"], "target": edge["targetID"]} for edge in data["edges"]]


(
  Graph(init_opts=opts.InitOpts(, ))
  .add(
    series_name="",
    nodes=nodes,
    links=edges,
    layout="none",
    is_roam=True,
    is_focusnode=True,
    label_opts=opts.LabelOpts(is_show=True),
    linestyle_opts=opts.LineStyleOpts(.5, curve=0.3, opacity=0.7),
  )
  .set_global_opts(title_opts=opts.TitleOpts(title="热词对应的关联词"))
  .render("关联词图.html")
)
最后,就生成了最开始的那张图。