ajax动态赋值echarts的实例(饼图和柱形图)
作者:猪哥
2018-03-02
本文以柱形图和饼形图ajax动态赋值为例
一、饼形图赋值步骤
(1)jsp页面
[html] view plain copy
(2)js页面
//饼图模板
var dom = document.getElementById("first");
var myChart = echarts.init(dom);
var app = {};
option = null;
option = {
    title : {
      text: '用户位置记录',
      subtext: '',
      x:'center'
    },
    tooltip : {
      trigger: 'item',
      formatter: "{a}
{b} : {c} ({d}%)"
    },
    legend: {
      orient : 'vertical',
      x : 'left',
      data:[]
    },
    toolbox: {
      show : true,
      feature : {
        mark : {show: true},
        dataView : {show: true, readOnly: false},
        magicType : {
          show: true,
          type: ['pie', 'funnel'],
          option: {
            funnel: {
              x: '25%',
              width: '50%',
              funnelAlign: 'left',
              max: 1548
            }
          }
        },
        restore : {show: true},
        saveAsImage : {show: true}
      }
    },
    calculable : true,
    series : [
      {
        name:'',
        type:'pie',
        radius : '55%',
        center: ['50%', '60%'],
        data:[]
      }
    ]
  };
;
if (option && typeof option === "object") {
  myChart.setOption(option, true);
}
//饼图动态赋值
var year = $("#year-search").val();
  var mouth = $("#mouth-search").val();
  $.ajax({
      type: "get",
      url: rootPath+"/wxbound/getPieDataByMouth.action",
      data : {"year":year,"mouth":mouth},
      cache : false,  //禁用缓存
      dataType: "json",
      success: function(result) {
        var names=[];//定义两个数组
         var nums=[];
         $.each(result,function(key,values){ //此处我返回的是list>循环map
           names.push(values.province_name);
           var obj = new Object();
           obj.name = values.province_name;
           obj.value = values.count;
           nums.push(obj);
          });
        myChart.setOption({ //加载数据图表
             legend: {
                data: names
                },
            series: {
                // 根据名字对应到相应的系列
                name: ['数量'],
                data: nums
                }
      });
      },
      error: function(XMLHttpRequest, textStatus, errorThrown) {
        alert("查询失败");
      }
    });
(3)后台代码根据你自己的代码就好
(4)显示样式
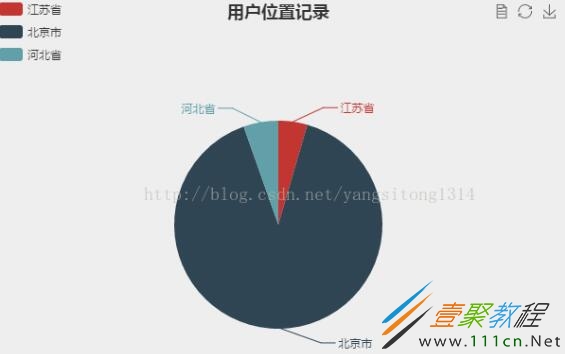
二、柱型图赋值步骤
(1)jsp页面
(2)js页面
//柱形图模板
var domLong = document.getElementById("second");
var myChartSecond = echarts.init(domLong);
var app = {};
option = null;
option = {
   color: ['#3398DB'],
   tooltip : {
     trigger: 'axis',
     axisPointer : {      // 坐标轴指示器,坐标轴触发有效
       type : 'shadow'    // 默认为直线,可选为:'line' | 'shadow'
     }
   },
   grid: {
     left: '3%',
     right: '4%',
     bottom: '3%',
     containLabel: true
   },
   xAxis : [
     {
       type : 'category',
       data : [],
       axisTick: {
         alignWithLabel: true
       }
     }
   ],
   yAxis : [
     {
       type : 'value'
     }
   ],
   series : [
     {
       name:'直接访问',
       type:'bar',
       barWidth: '60%',
       data:[]
     }
   ]
 };
if (option && typeof option === "object") {
 myChartSecond.setOption(option, true);
}
//给柱形图赋值
 var year = $("#year-search").val();
 $.ajax({
      type: "post",
      url: rootPath+"/wxbound/getWxboundList.action",
      data : {"year":year},
      cache : false, //禁用缓存
      dataType: "json",
      success: function(result) {
     console.log(result);
     var linNames=[];
   var linNums=[];
     $.each(result.lin,function(key,values){

     linNames.push(values.mouth);
     linNums.push(values.count);

    });
   //柱形图赋值
   myChartSecond.setOption({ //加载数据图表
    xAxis: {
                data: linNames
                },
            series: {
             // 根据名字对应到相应的系列
             name: ['数量'],
             data: linNums
         }
    });
      },
      error: function(XMLHttpRequest, textStatus, errorThrown) {
        alert("查询失败");
      }
    });
}
(3)后台代码部分根据自己需要就好。。。
(4)图片样式
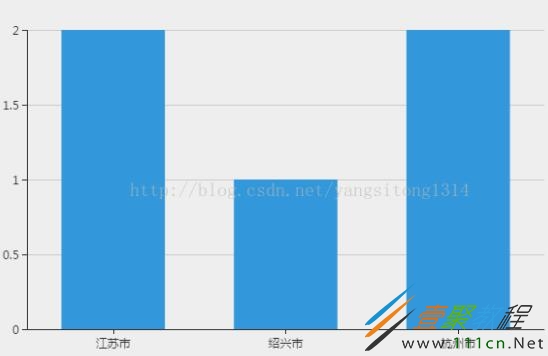
可以去试试你的echarts图标了。。。